
Page 3 - HMC_2014AR_Cover_032615.indd
P. 3
FINANCIAL DATA & RATIOS
2014
500,781 85,201 83,124 17,824 17,272
0.05 209,665 151,089 2,262,064
367,377 353,442 1,354
11,090,506 186,997 40,255 67,969 4.81 826 19.08 18.46 1,266 1,262
2013
382,589 66,146 26,644 (25,130) (25,682)
(0.08) 212,175 161,233 2,232,119
342,663 318,679 1,321
8,919,728 119,989 30,374 61,406 6.84 951 23.83 21.28 1,411 1,317
FINANCIAL HIGHLIGHTS
(Dollars in thousands except in per share and per ounce amounts / as of December 31)
Sales of products
Gross profit
Cash flow provided by operating activities
Net income (loss)
Net income (loss) applicable to common shareholders Basic income (loss) per common shares
Cash, cash equivalents and short-term investments Capital expenditures
Total assets
YEAR-END DATA
Common shares outstanding (in thousands)
Weighted average number of shares outstanding for the year – basic (in thousands) Employees
OPERATIONAL DATA
Silver production (oz)
Gold production (oz)
Lead production (tons)
Zinc production (tons)
Cash cost, after by-product credits, per silver ounce (1) Cash cost, after by-product credits, per gold ounce (1) Average silver price per ounce (London PM Fix) Average realized silver price per ounce
Average gold price per ounce (London PM Fix) Average realized gold price per ounce
$
$
$ $ $ $ $ $
$ $ $ $ $ $
(1) Cash costs, after by-product credits, per silver and gold ounce represent non-U.S. generally accepted accounting principles (GAAP) measurements. The primary metal produced at Casa Berardi is gold, with a by-product credit for the value of silver production. A reconciliation of total cash costs to cost of sales and other direct production costs and depreciation, depletion and amortization (GAAP) can be found in the Reconciliation of Cash Cost, Before By-product Credits and Cash Cost, After By-product Credits (non-GAAP) to Cost of Sales and Other Direct Production Costs and Depreciation, Depletion, and Amortization (GAAP) section in the company’s Form 10-K, included in this report.
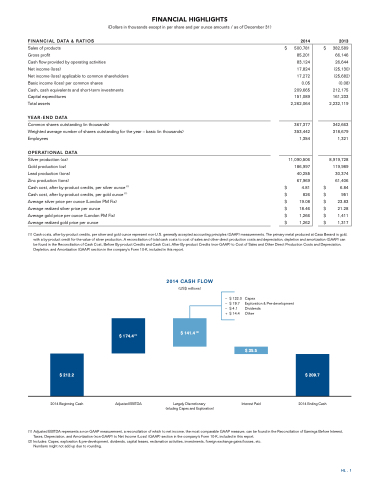
2014 CASH FLOW
(US$ millions)
– $ 132.0
– $ 19.7
– $ 4.1
+ $ 14.4
Capex
Exploration & Pre-development Dividends
Other
$ 35.5
$ 174.4 (1)
$ 141.4 (2)
$ 212.2
$ 209.7
2014 Beginning Cash
Adjusted EBITDA
Largely Discretionary (inluding Capex and Exploration)
Interest Paid
2014 Ending Cash
(1) Adjusted EBITDA represents a non-GAAP measurement, a reconciliation of which to net income, the most comparable GAAP measure, can be found in the Reconciliation of Earnings Before Interest, Taxes, Depreciation, and Amortization (non-GAAP) to Net Income (Loss) (GAAP) section in the company’s Form 10-K, included in this report.
(2) Includes: Capex, exploration & pre-development, dividends, capital leases, reclamation activities, investments, foreign exchange gains/losses, etc. Numbers might not add up due to rounding.
HL . 1
