
Page 3 - HMC_201610k_032217.indd
P. 3
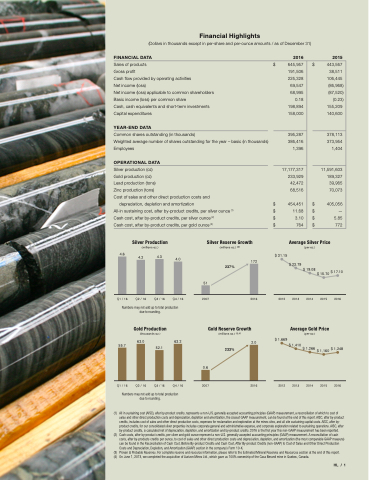
  Financial Highlights
(Dollars in thousands except in per-share and per-ounce amounts / as of December 31)
FINANCIAL DATA
Sales of products $ Gross profit
Cash flow provided by operating activities
Net income (loss)
Net income (loss) applicable to common shareholders Basic income (loss) per common share
Cash, cash equivalents and short-term investments Capital expenditures
YEAR-END DATA
Common shares outstanding (in thousands)
Weighted average number of shares outstanding for the year – basic (in thousands) Employees
OPERATIONAL DATA
Silver production (oz)
Gold production (oz)
Lead production (tons)
Zinc production (tons)
Cost of sales and other direct production costs and
depreciation, depletion and amortization $ All-in sustaining cost, after by-product credits, per silver ounce (1) $ Cash cost, after by-product credits, per silver ounce (2) $ Cash cost, after by-product credits, per gold ounce (2) $
2016
645,957 $ 191,506 225,328
69,547 68,995 0.18 198,894 158,000
395,287 386,416 1,396
17,177,317 233,929 42,472 68,516
454,451 $ 11.68 $ 3.10 $ 764 $
2015
443,567 38,511 106,445 (86,968) (87,520)
(0.23) 155,209 140,600
378,113 373,954 1,404
11,591,603 189,327 39,965 70,073
405,056 — 5.85 772
           4.6
Q1 / 16
4.2
Q2 / 16
4.3
Q3 / 16
4.0
Q4 / 16
(millions oz.) (3)
237%
172
2016
$ 31.15
$ 23.79
(per oz.)
$ 19.08 $ 15.70 $ 17.10
2014 2015 2016
Silver Production
(millions oz.)
Silver Reserve Growth
Average Silver Price
            51 2007
2012
$ 1,669
2012
2013
      Numbers may not add up to total production due to rounding.
  55.7
Q1 / 16
Q2 / 16
52.1
Q3 / 16
63.2
0.6 Q4 / 16 2007
2.0
2016
(per oz.)
$ 1,410 $ 1,266 $ 1,160 $ 1,248 2013 2014 2015 2016
Gold Production
(thousands oz.) 63.0
Gold Reserve Growth
(millions oz.) (3,4)
233%
Average Gold Price
                Numbers may not add up to total production due to rounding.
(1) Allinsustainingcost(AISC),afterby-productcredits,representsanon-U.S.generallyacceptedaccountingprinciples(GAAP)measurement,areconciliationofwhichtocostof sales and other direct production costs and depreciation, depletion and amortization, the closest GAAP measurement, can be found at the end of this report. AISC, after by-product credits, includes cost of sales and other direct production costs, expenses for reclamation and exploration at the mines sites, and all site sustaining capital costs. AISC, after by- product credits, for our consolidated silver properties includes corporate general and administrative expense, and corporate exploration related to sustaining operations. AISC, after by-product credits, is calculated net of depreciation, depletion, and amortization and by-product credits. 2016 is the first year this non-GAAP measurement has been reported.
(2) Cashcosts,afterby-productcredits,persilverandgoldouncerepresentanon-U.S.generallyacceptedaccountingprinciples(GAAP)measurement.Areconciliationofcash costs, after by-products credits per ounce, to cost of sales and other direct production costs and depreciation, depletion, and amortization (the most comparable GAAP measure) can be found in the Reconciliation of Cash Cost, Before By-product Credits and Cash Cost, After By-product Credits (non-GAAP) to Cost of Sales and Other Direct Production Costs and Depreciation, Depletion, and Amortization (GAAP) section in the company’s Form 10-K.
(3) Proven&ProbableReserves.Forcompletereserveandresourceinformation,pleaserefertotheEstimatedMineralReservesandResourcessectionattheendofthisreport.
(4) OnJune1,2013,wecompletedtheacquisitionofAurizonMinesLtd.,whichgaveus100%ownershipoftheCasaBerardimineinQuebec,Canada.
HL / 1
